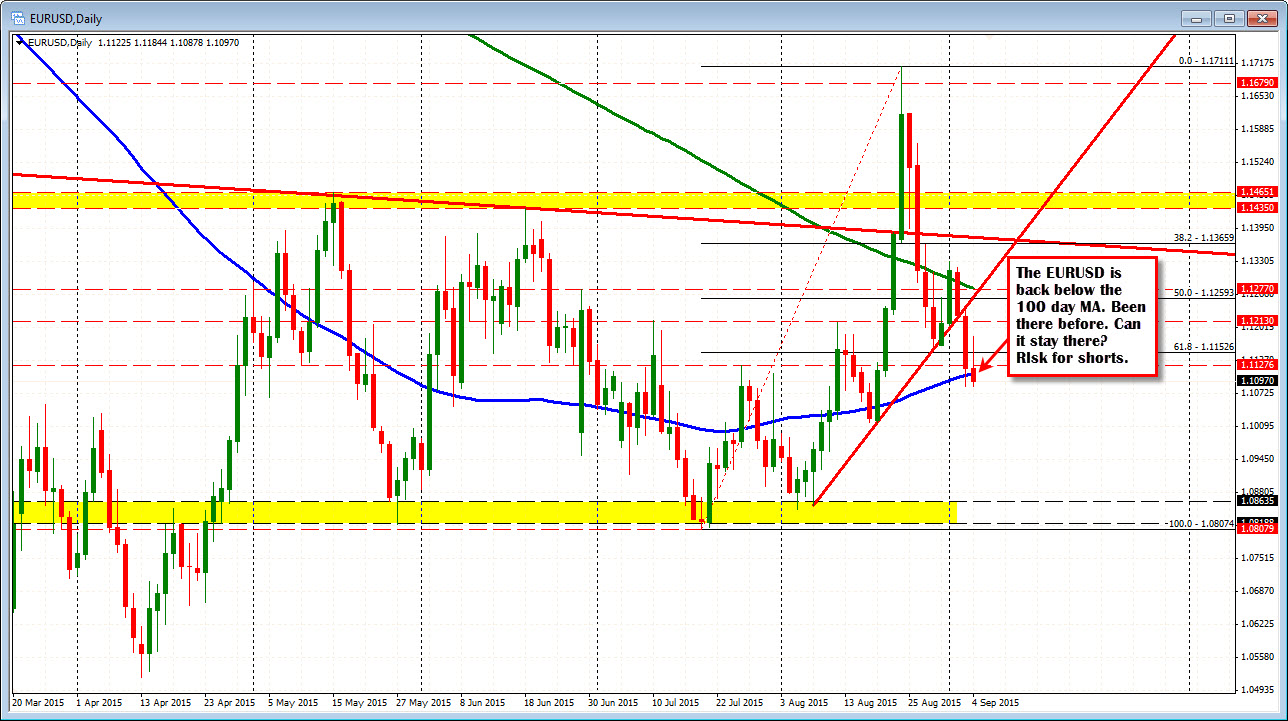
Not a concern, unless it is....
The BOE decision was highlighted by the headline that the "global events haven't altered MPC central view". Then came the "But". That sentence read, "but the greater downside risks to the global environment merit close monitoring for any impact on domestic economic activity"
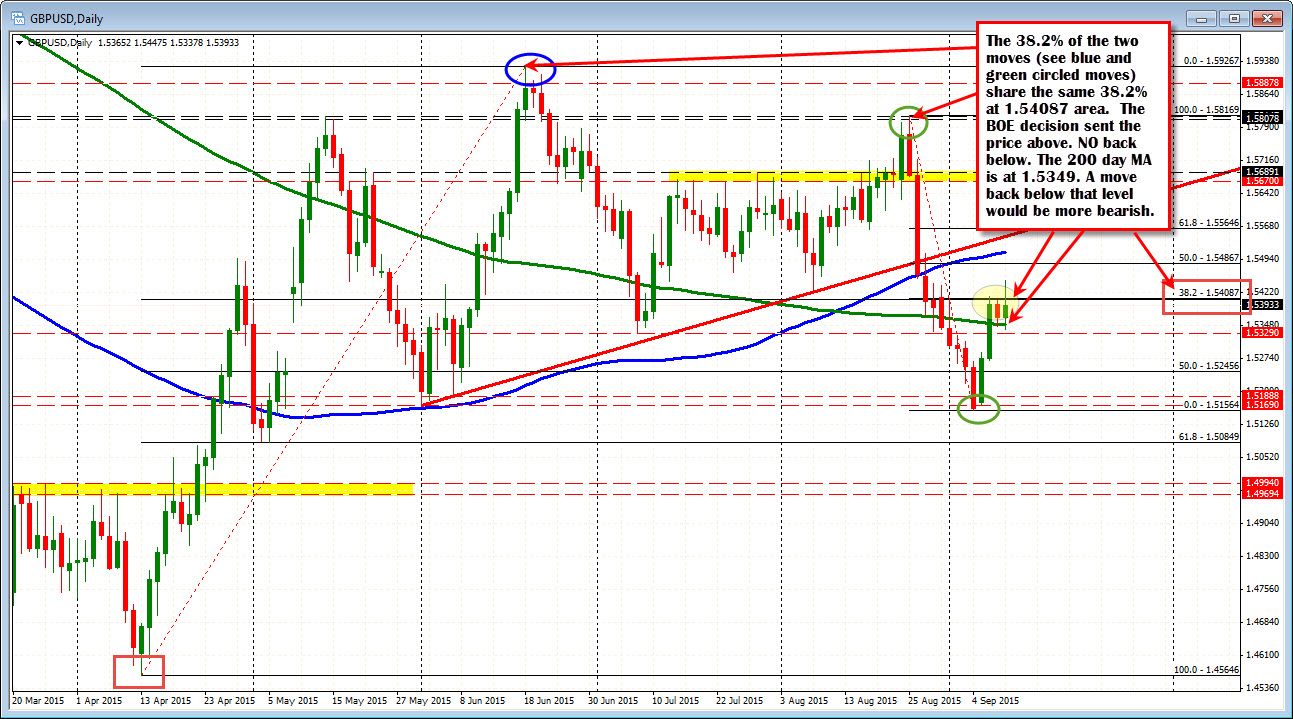
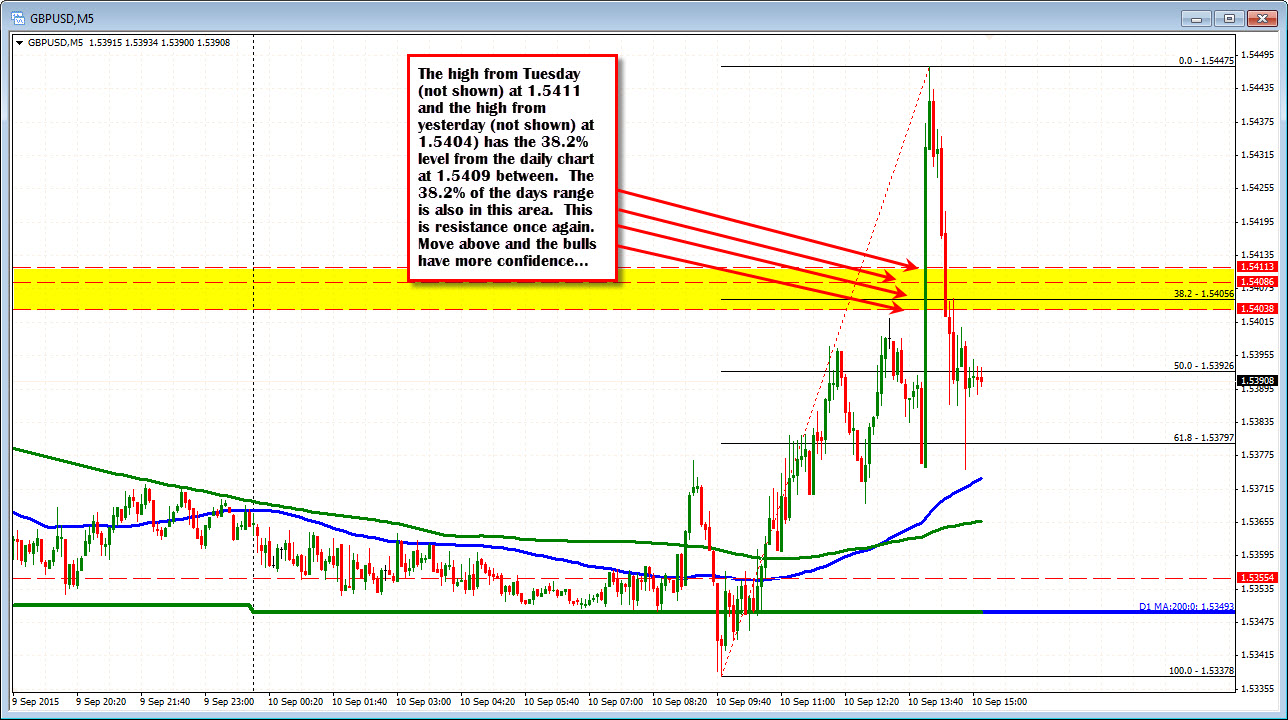
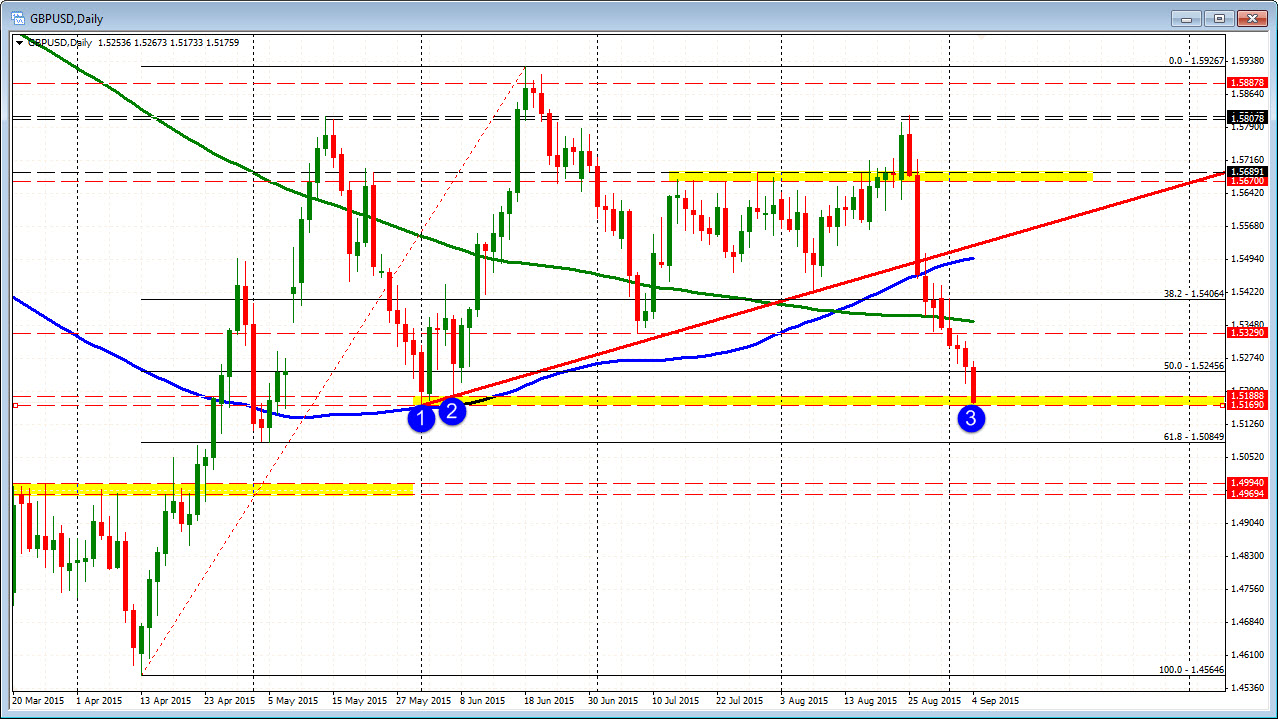
The price moved to the 1.5450 level (good call Mike) and the started to come back down. Looking at the daily chart, there are two 38.2% retracements on the chart.
- The nearer term fall from the August high to the September low at 1.5409
- The one from the move up from the April 2015 low to the June 2015 high. That too comes in at 1.5409
The high price on Tuesday reached 1.5411. The high price yesterday reached reached 1.5404. We are back below that level now and if the price is to go back higher. That level should be eyed.
What does the intraday price action show? Looking at the 5 minute chart the spike higher has led to a tumble lower and a move back to where it all started. The 1.5404-11 area (highs from Tuesday and Wednesday and the dual 38.2% from the daily chart - yellow area in the chart below) was raced through on the way up and has also helped to provide resistance after the fall back down. Note that the 38.2% of the days range is smack in the middle of that yellow area as well (see chart below). So fair enough to say, that is a key area for trading going forward. Move above it and we go higher.
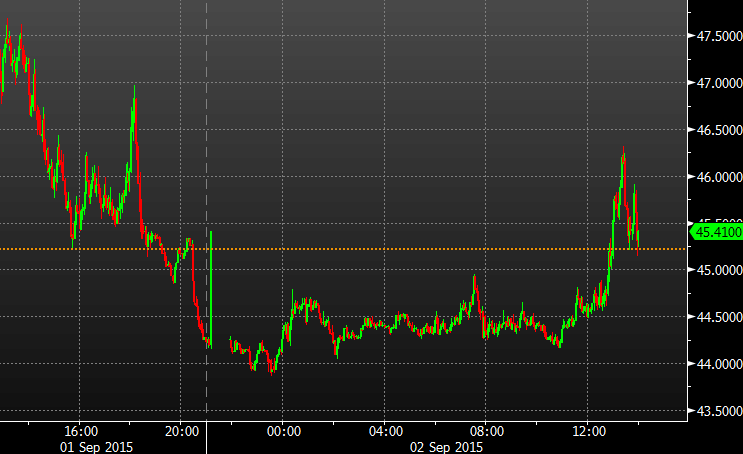
ON the downside, the tumble lower stalled at the low right before the decision and against the 100 bar MA on the 5-minute chart. Is this the downside support to base? Well lets see claims and see if the dollar side wants to take charge. There has been some damage left from the lap to the upside and downside. The market is taking a breathe.
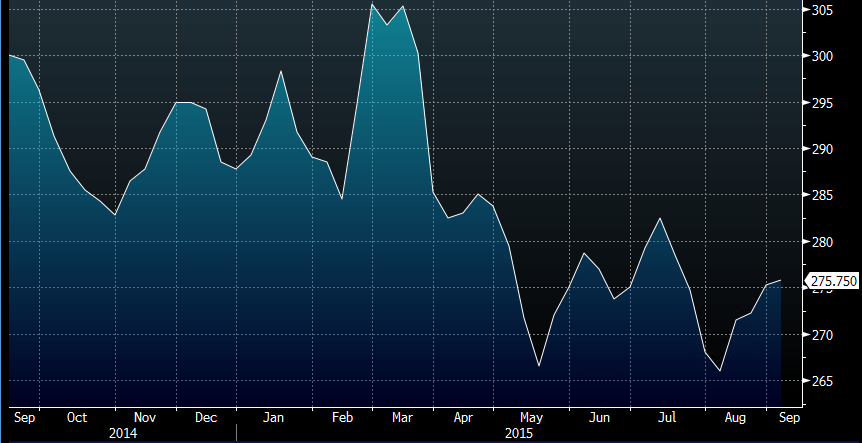 Initial jobless claims 4 week average
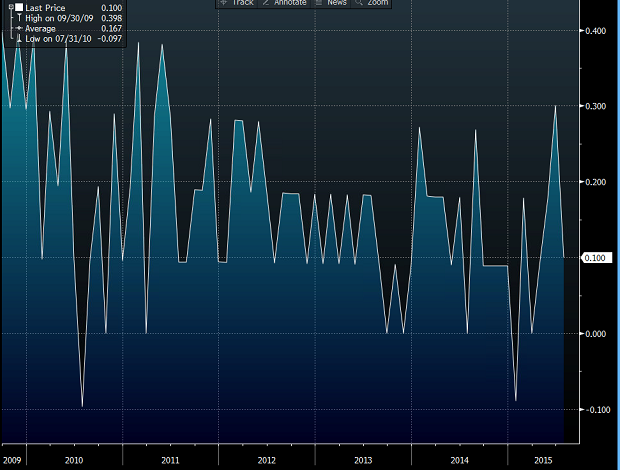

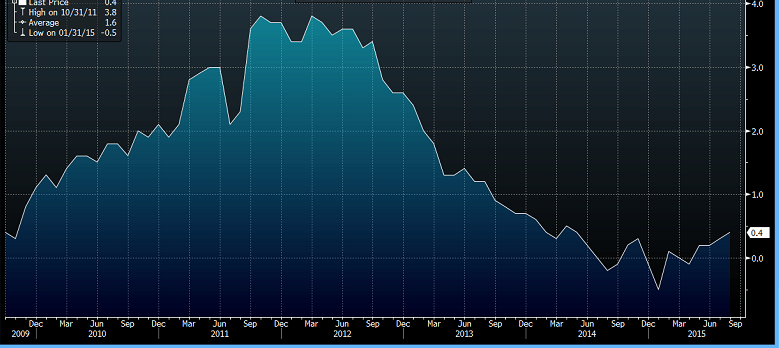
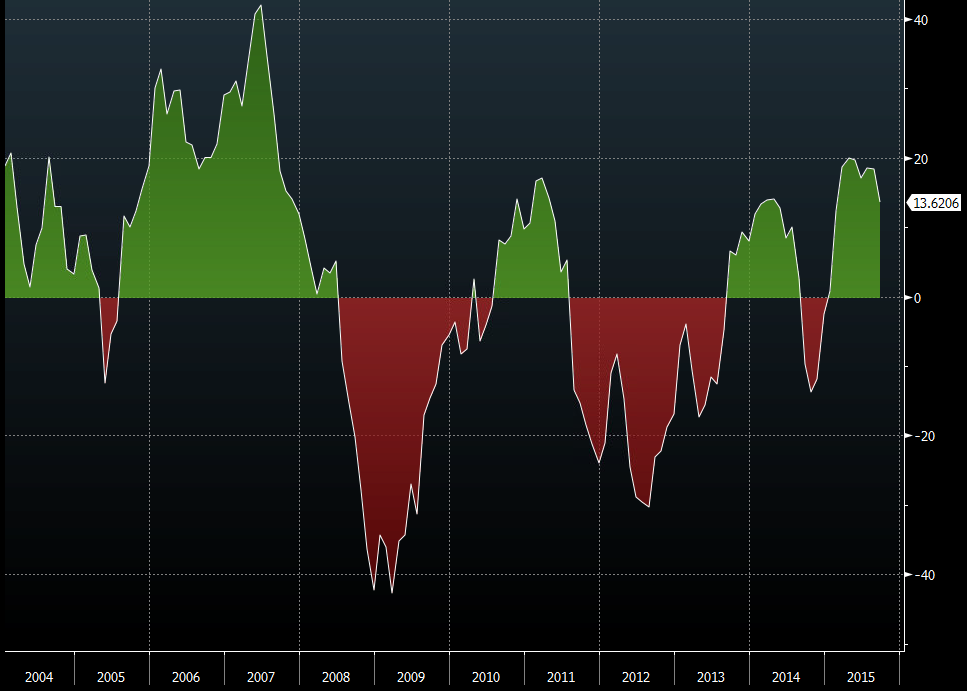 Eurozone Sentix investor confidence index
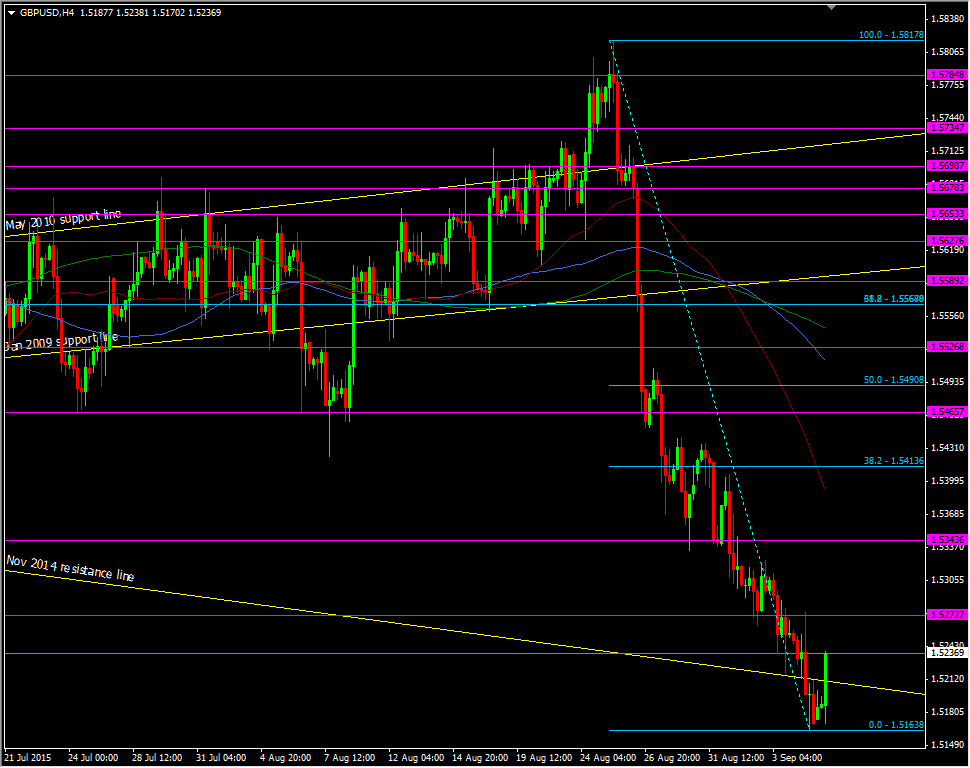 GBPUSD H4 chart
 Irish services PMI
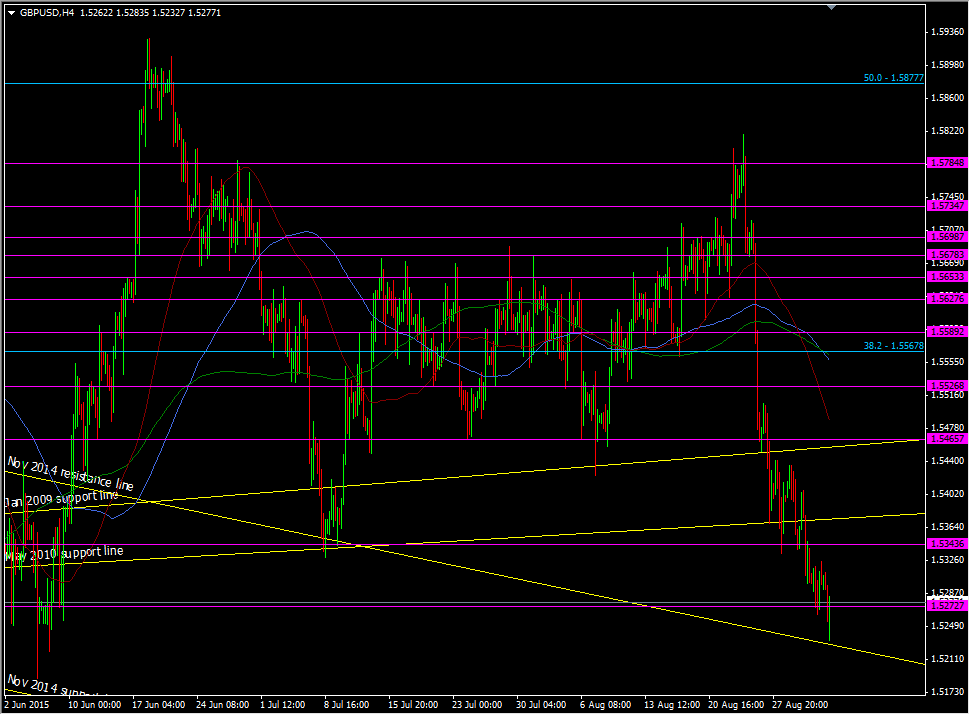 GBPUSD H4 chart
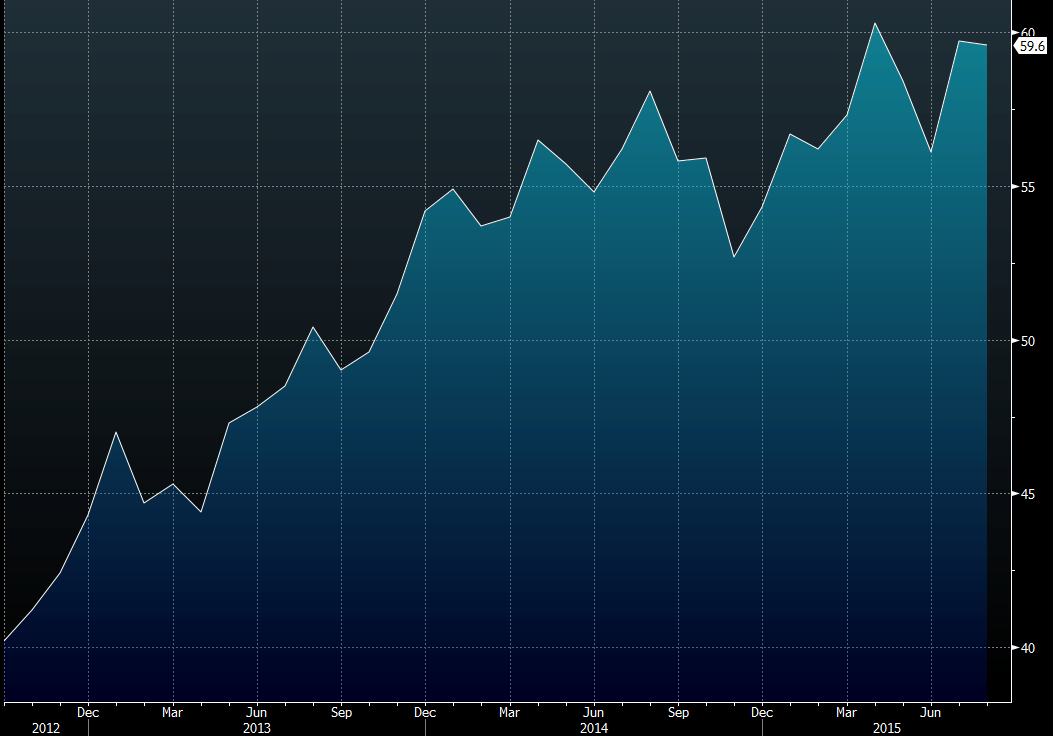 Spain services PMI
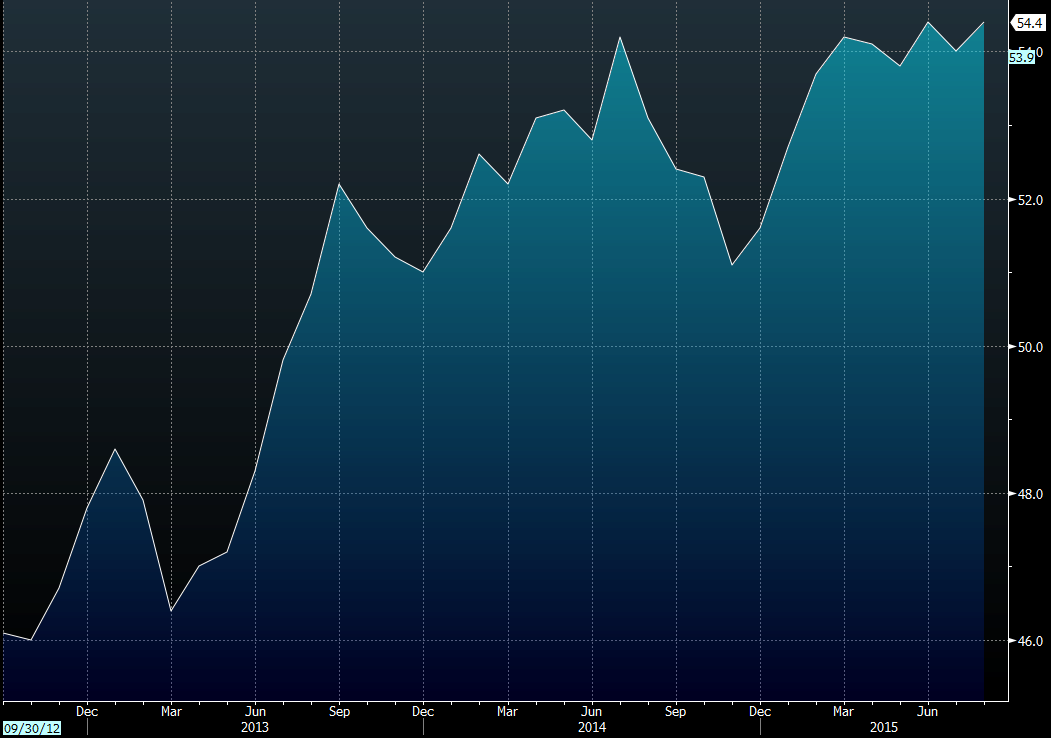
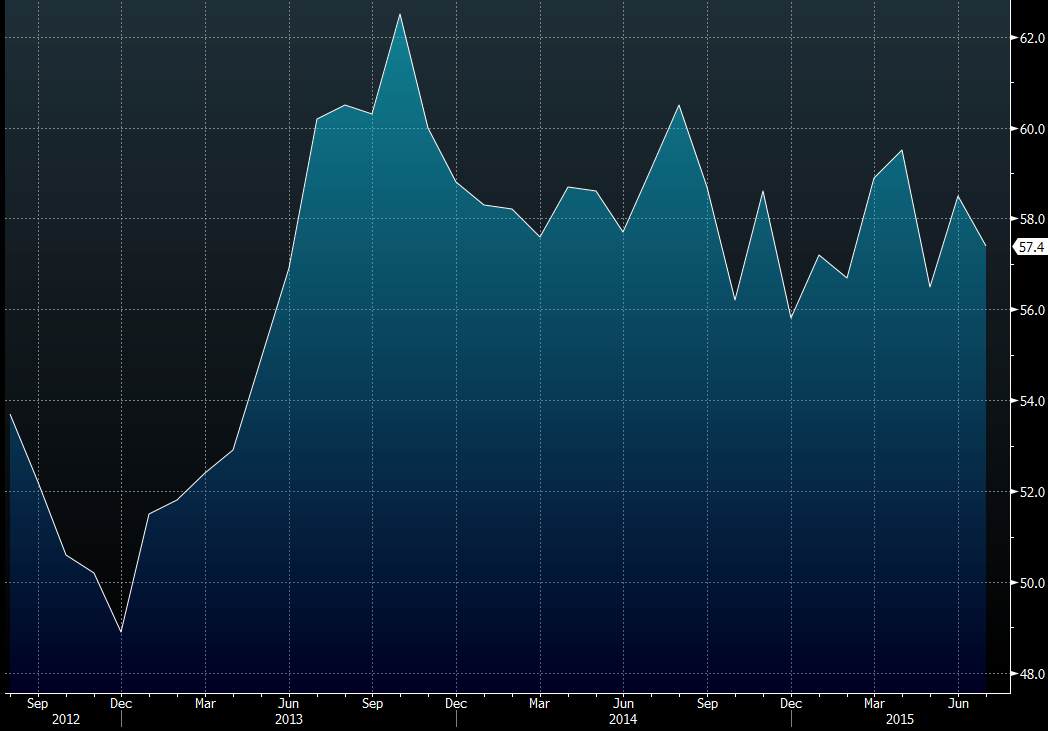 UK services PMI
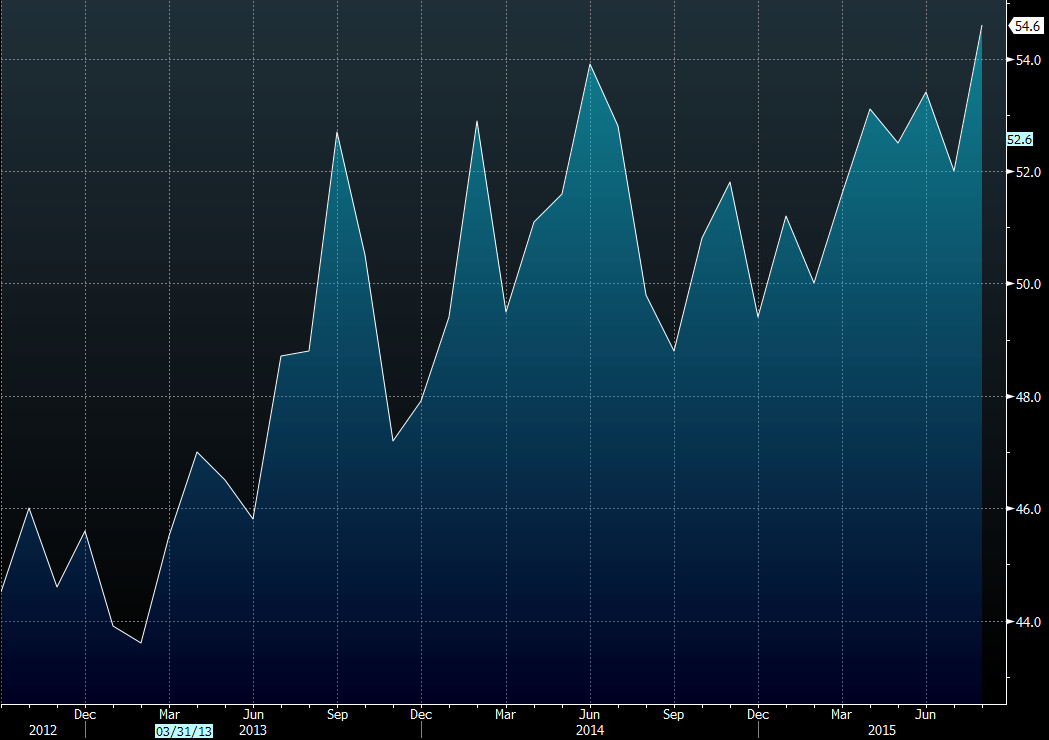

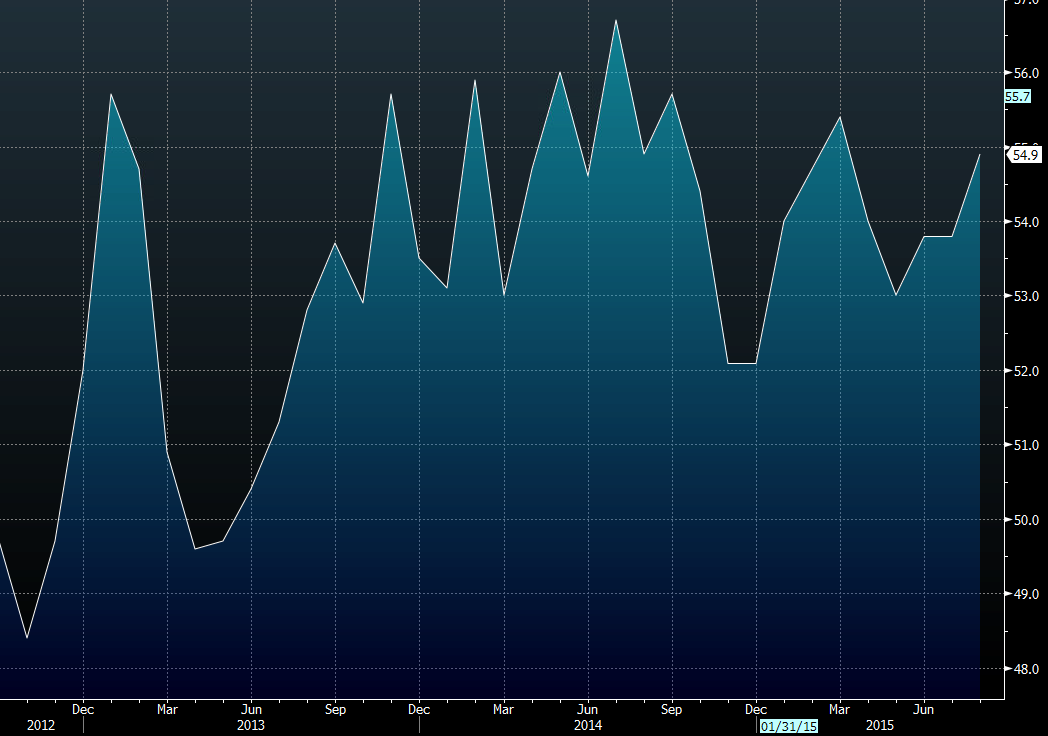
 Eurozone services PMI
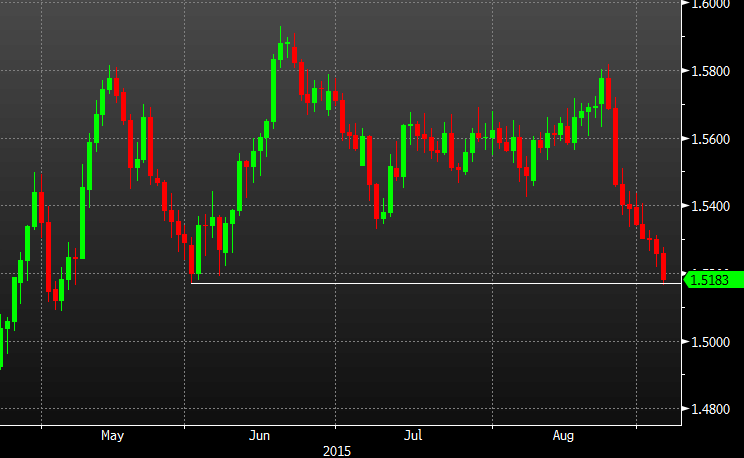
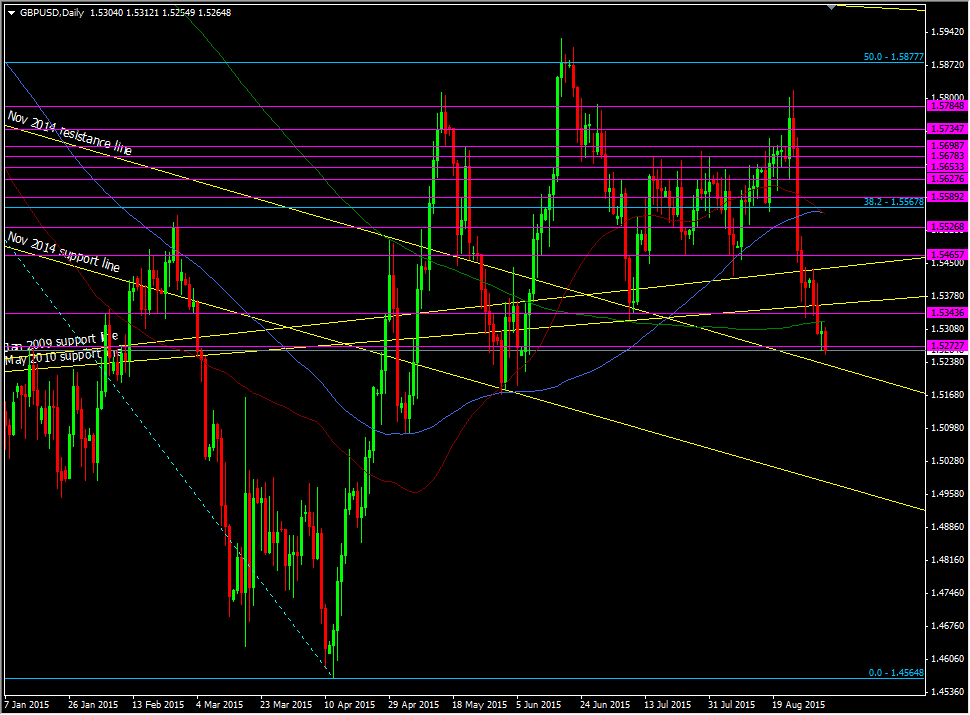 GBPUSD daily chart
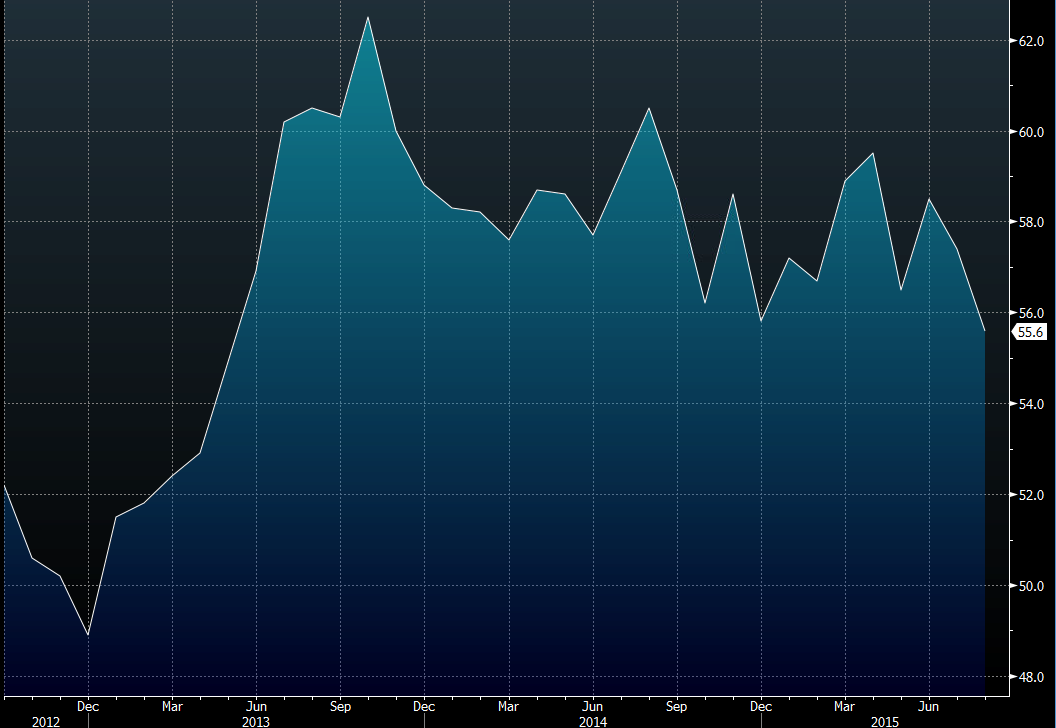 UK services PMI
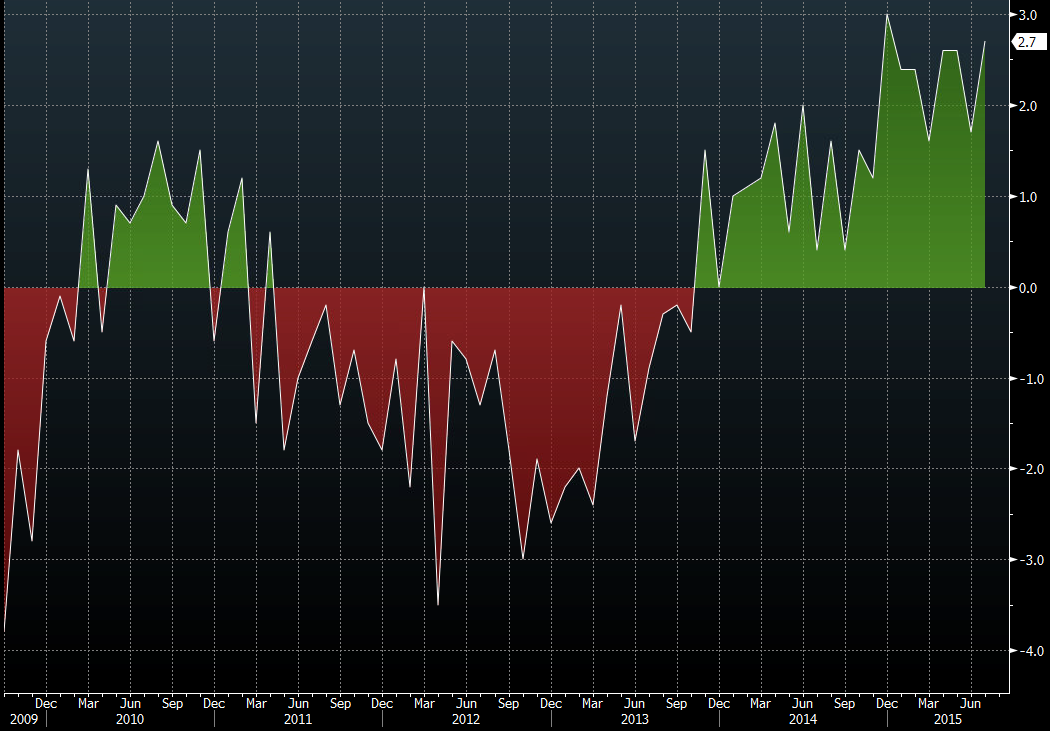 Eurozone retail sales y/y