Monday 31 August 2015

WTI crude oil extends gains to $3. Here's why

WTI crude up more than 6% in third day of gains

There are two popular theories as to why crude oil prices turned around today. Here's why they don't add up.
1) Falling US oil production
The EIA released a new report today and it showed US production at 9.3 million barrels per day in June compared to 9.4 mpbd
2) This is the headline that people are pointing too:
Here is the full quote from the OPEC publication, which is really a magazine, not some kind of statement from the cartel.
"As the Organization has stressed on numerous occasions, it stands ready to talk to all other producers."
Continuing: "There is no quick fix, but if there is a willingness to face the oil industry's challenges together, then the prospects for the future have to be a lot better than what everyone involved in the industry has been experiencing over the past nine months or so. Only time will  tell."
The best reasons for oil gains
They're the same three reason oil has gained for the previous two days
  1. China cut rates
  2. Sentiment rebounded
  3. Massive short squeeze

Higher oil could give Fed more confidence on inflation

Three-day, 27% jump in oil prices an important factor for Fed

Fed funds implied odds of a hike in September have risen to 40% from 38% earlier today. The recovery in stocks is one factor behind the rising probability but oil might be the larger driver.
The Fed tries to look through oil prices but lower commodities give them more flexibility in terms of the timing of a hike. In other words, depressed prices would have given the Fed more breathing room to wait until December. But with the rebound, the August oil decline has been almost entirely reversed.

Fed hike odds vs Wednesday

  • Sept 40% vs 24%
  • Oct 49.6% vs 33%
  • Dec 62.7% vs 49.2%
  • Jan 66.4% vs 54.3%
  • Mar 78.5% vs 68.0%

GBPUSD makes it's way below 200 day MA

EURGBP helping 

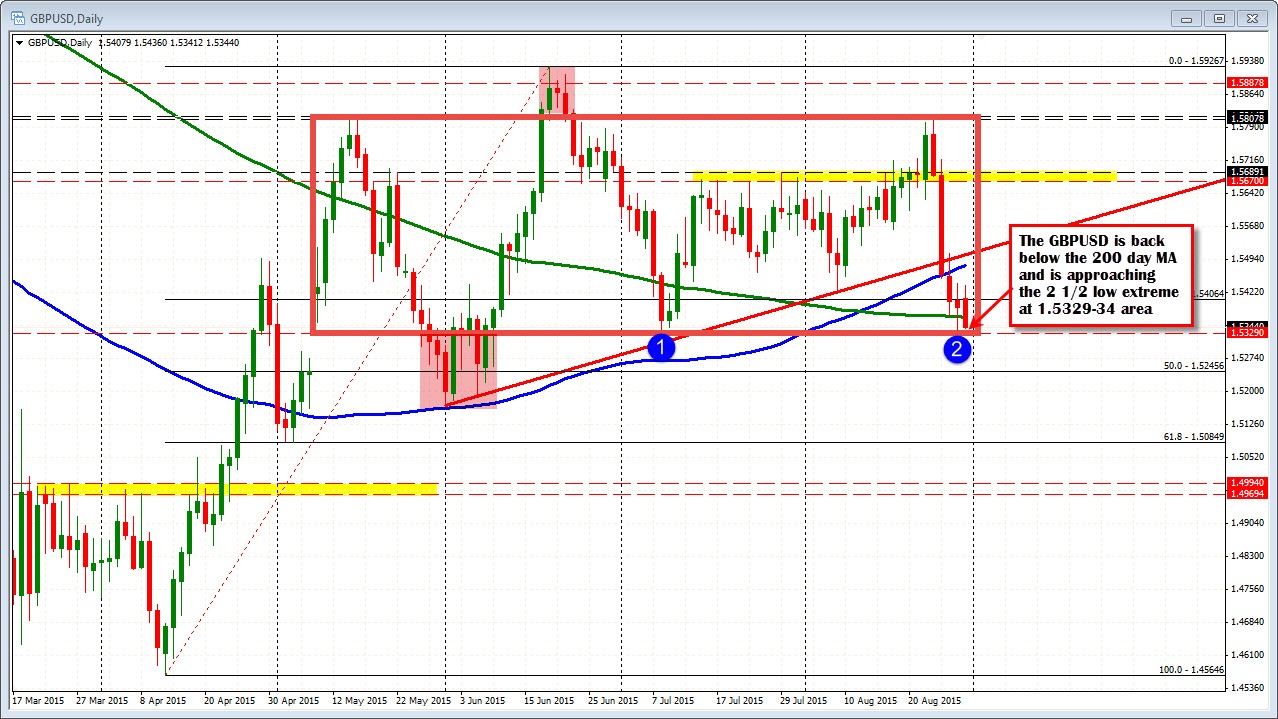
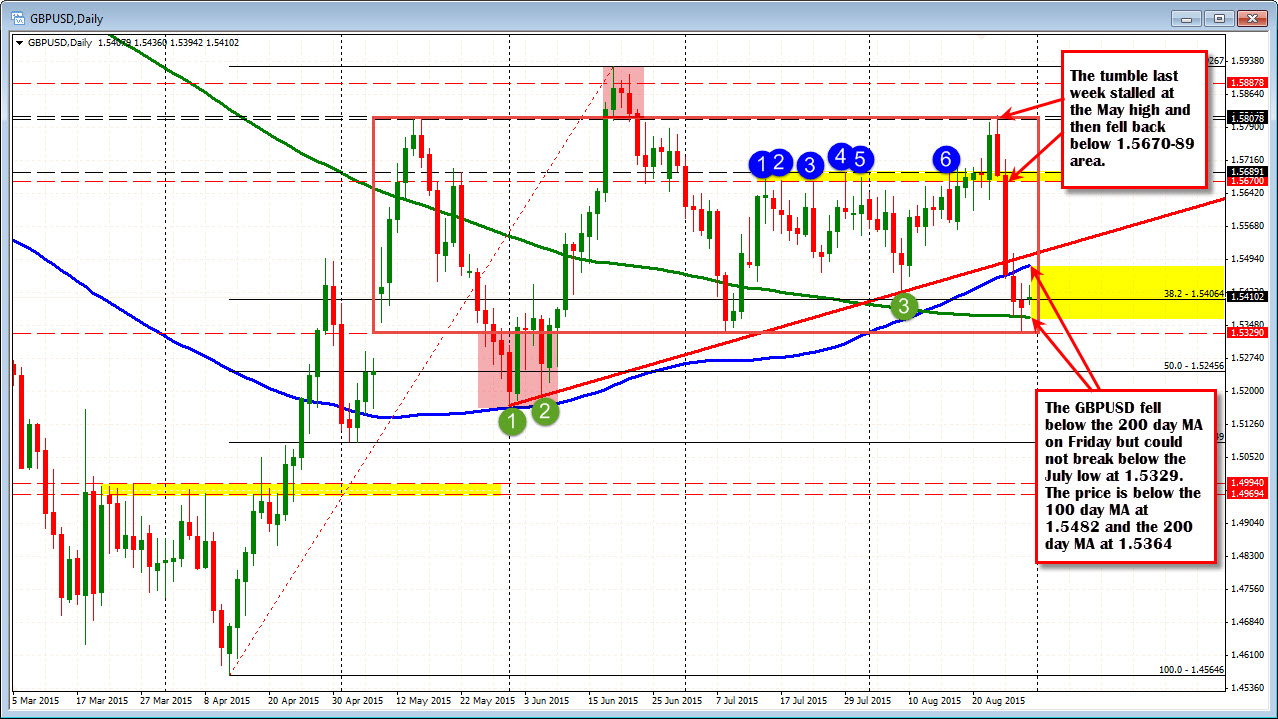
The GBPUSD has moved below the 200 day MA (has not closed below since July 9th) and approaches the lows from July at 1.5329 and the low from Friday at 1.5334. A move below both these lows should solicit more selling with the 1.52456 the next target.

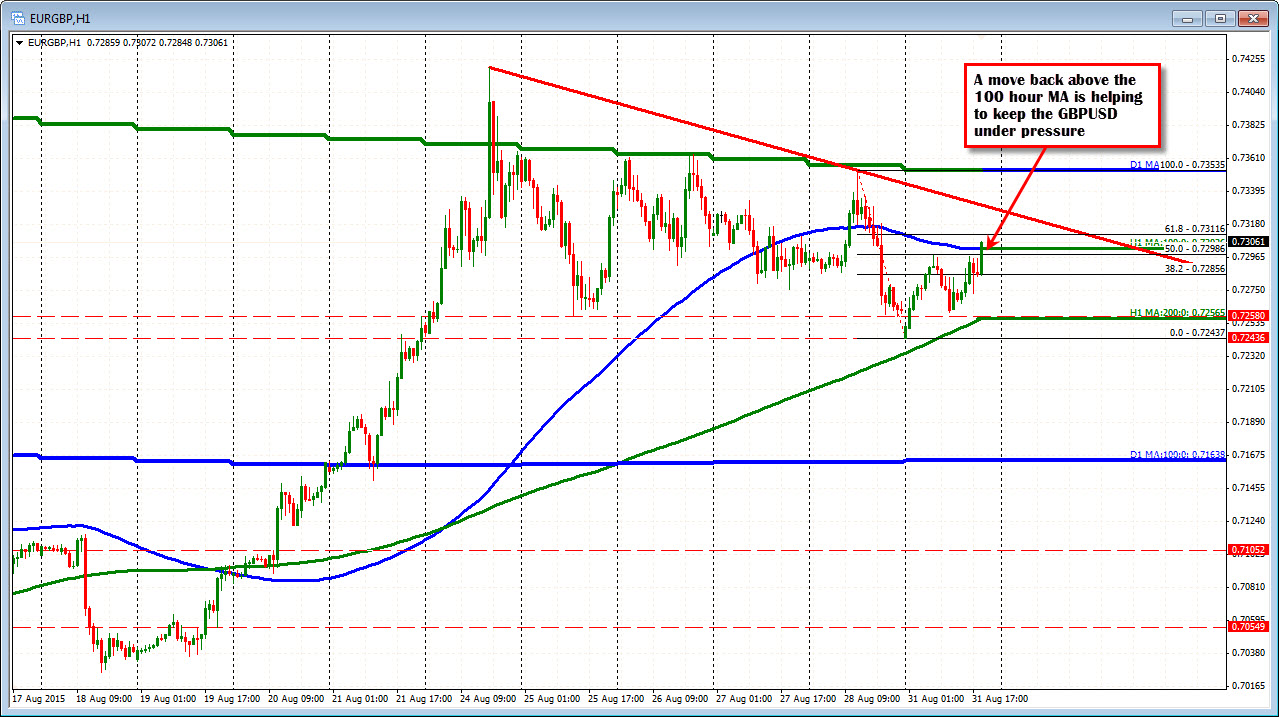
Meanwhile, on a end of summer Monday, the EURGBP is starting to get in the act. It has moved above the 100 hour MA in the last hour of trading which is helping to keep a lid on the GBPUSD while helping the EURUSD.  


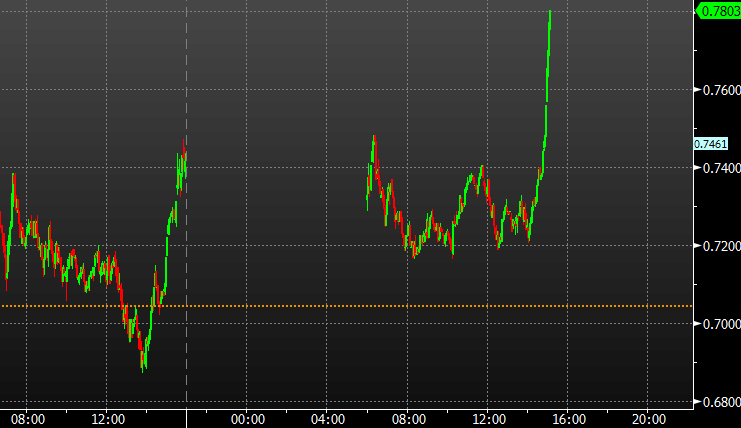
Oil shoots higher on OPEC talk

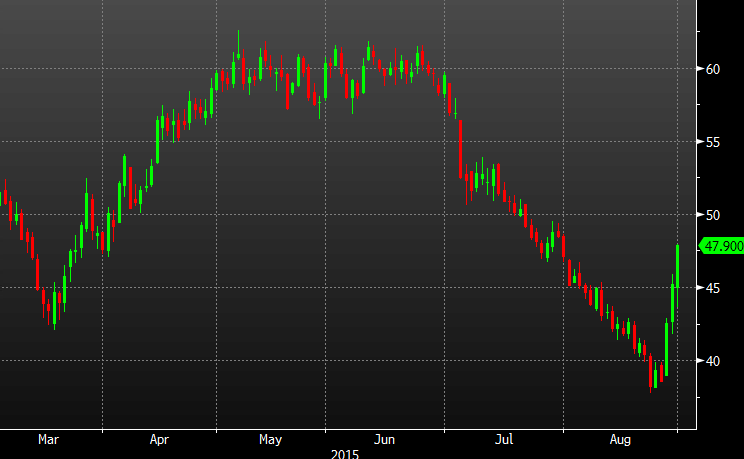
Oil prices hit $47.59

OPEC said it was concerned about "today's continuing pressure on prices" in a publication today and said it was ready to talk to other producers about the market.
It's the third consecutive day of sharp oil price gains.
For me, this is a story that's being massaged to fit the price action. OPEC has long said it would cut production but only if the rest of the world did as well. That's just not going to happen.
This is a pure squeeze and an incredible one.
USD/CAD implications
In terms of FX, this has been responsible for the turnaround in USD/CAD but what stands out most is that USD/CAD is still 20 pips higher on the day. Oil is up 27% from last Monday's low and yet USD/CAD is still higher. That's a deeply troubling sign for CAD bulls.

USDCAD coming back down


Oil prices up.  Month end volatility impacting as well

The USDCAD has fallen back down after rising in earlier North American trading. 

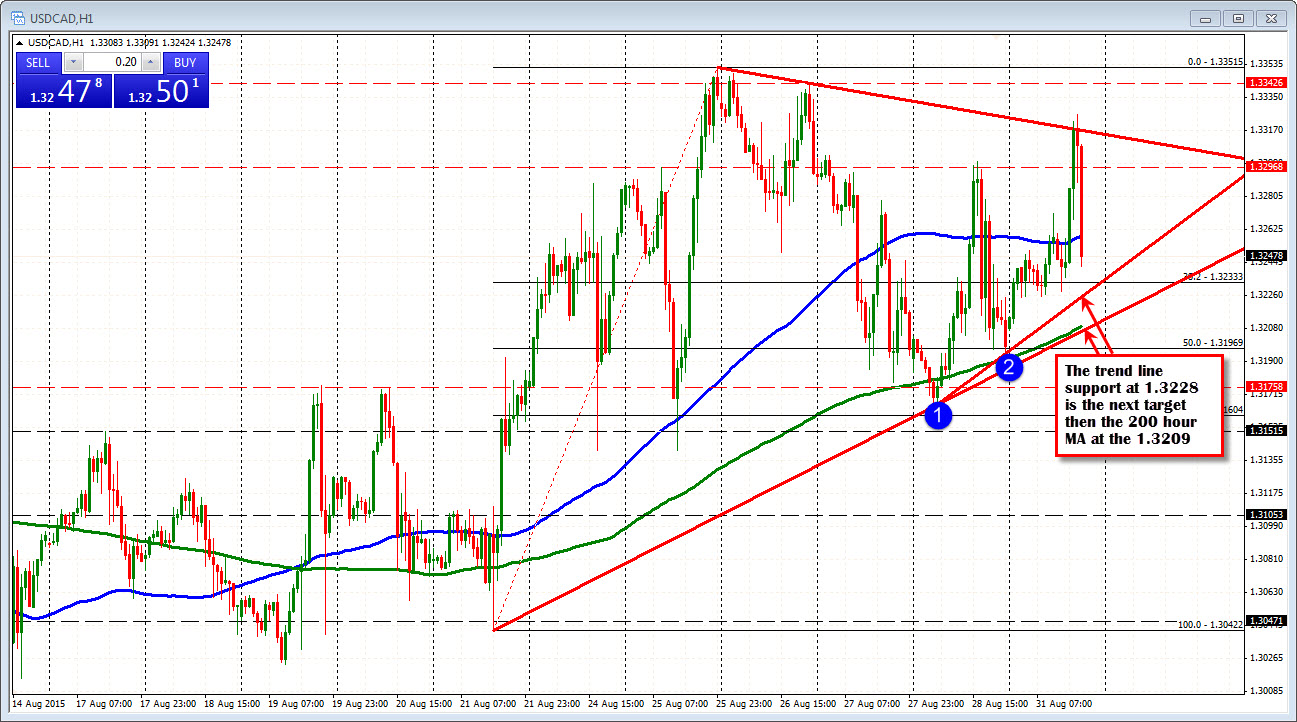
The pair at the highs extended briefly above a trend line connecting the recent highs. That did not hold up. Oil prices are up today and so is market volatility in the last hour or so and that has helped lead to a move back lower. The price is currently trading back below the 100 hour MA with trend line support at the  1.3228 level the next target. Below that is the 200 hour MA at the 1.3209. The low in the 1st hour of trading today came in at 1.32068. Are we heading for a complete day lap in the USDCAD. It is starting to look that way.
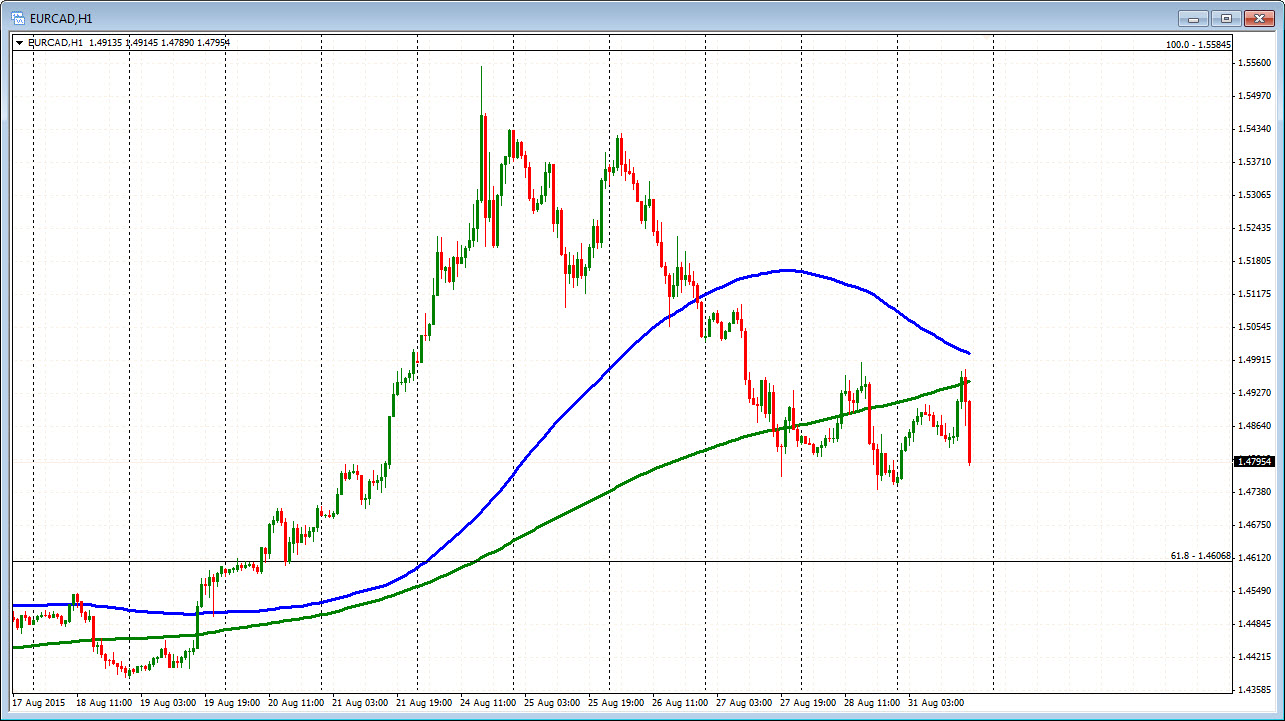
PS. EURCAD has tumbled as well after failing on a move above the 200 hour MA at the 1.4951 level (the high reached 1.4975)

European stocks slide with UK on holiday

Closing changes for the main European bourses:

  • German DAX -0.4%
  • French CAC -0.5%
  • Spain IBEX -0.5%
  • Italy MIB -0.2%
Much quieter trading than we've grown accustomed to but I think that has to do more with the UK holiday and month-end than a sudden relief.

Quick bund rout giving a lift to the euro


German 10-year yields jump 5 bps as month-end nears

No one wants to be holding German bunds into month end. They're getting torn up and it's helped the euro rebound from below 1.1200.
I'll say it again: Month-end is the most dangerous time to trade.

New Zealand dollar falls 2%. Why there is more to come

New Zealand dollar down nearly 2%

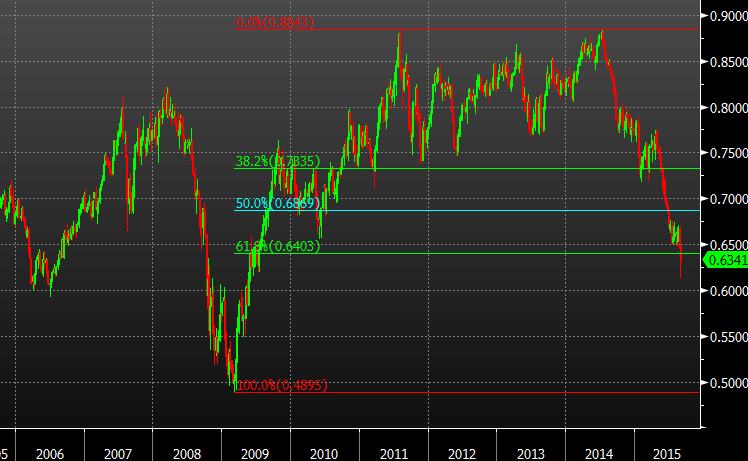
The kiwi is on pace for its lowest close since 2009. The drop in NZD was prompted by broader commodity worries and US dollar gains.
The pair stabilized last week after falling as much as 8% and then recovering two-things of the losses. The inability to rebound further alongside stocks, commodities and recovering sentiment was a warning sign and now NZD/USD is under heavy pressure.
The pair stumbled early today after soft ANZ business confidence but then traded sideways around 0.6415 until US traders arrived. Since then, it's turned sharply lower and just hit a session low of 0.6325.
ANZ warned in the report that "economic activity has fallen to a three-year low, with the economy approaching 'stall speed.'" They also noted that several components of the report were at the lowest since 2009.

Technical analysis

This could get much worse. If we look at the entire scope of the 2009-2014 rally, we've now given back more than 61.8% of the gains.

EURUSD: Bounces off support

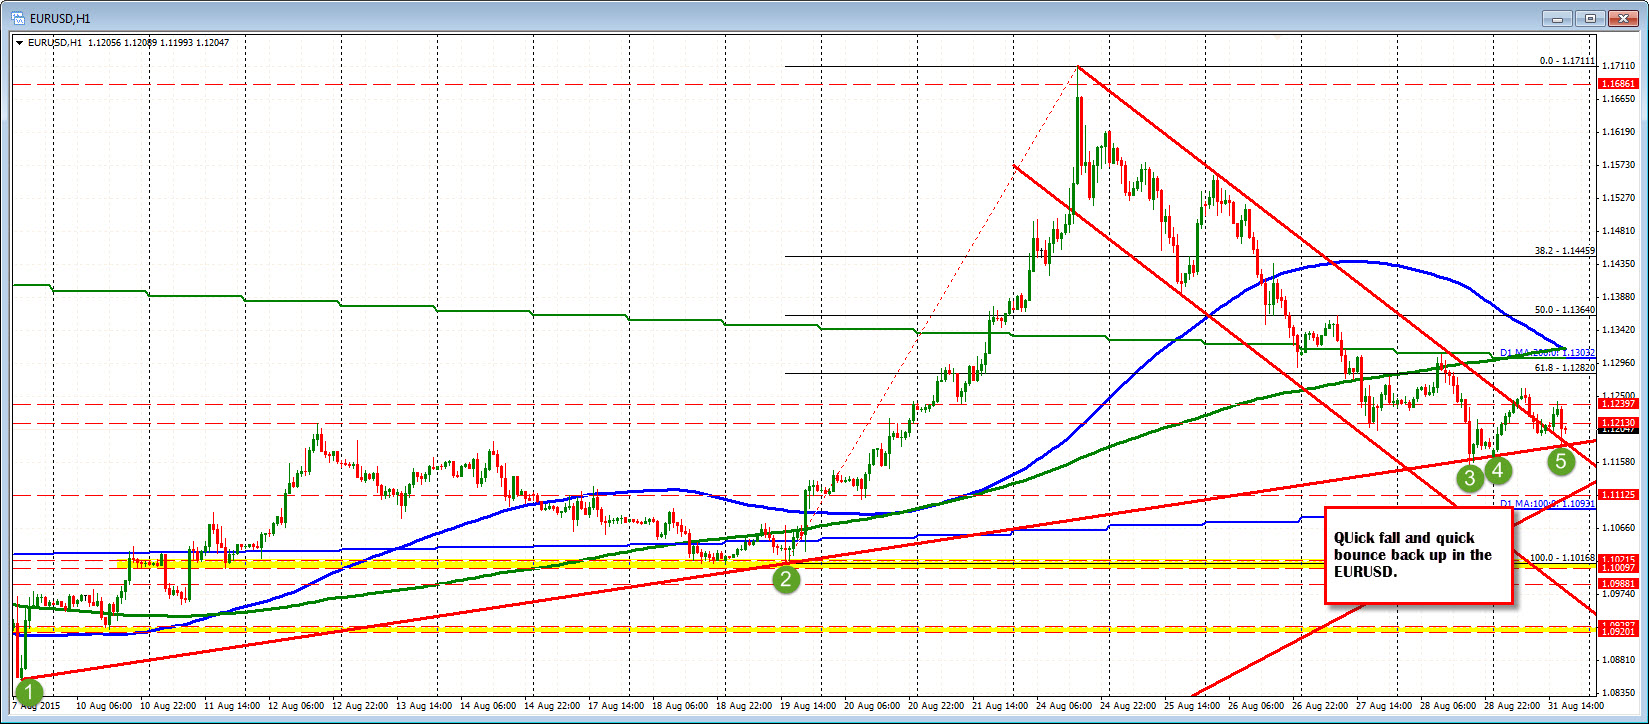
Trend line holds on a test.

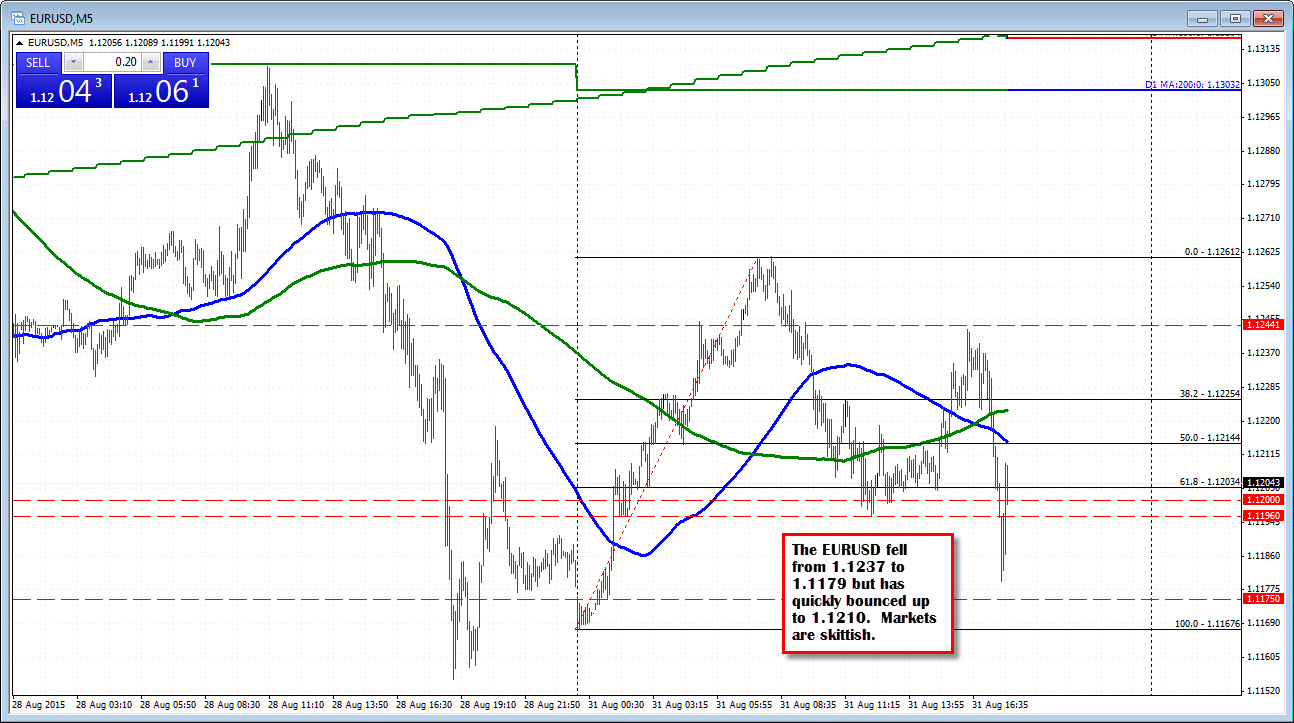
The EURUSD fell to support trend line (see earlier report outlining the technical level) and is bouncing. The trend line on the current bar came in at 1.11767. The low reached 1.1179. The price is back up above 1.1200.  


The market bounce seems to highlight the skittishness of the market. It did fall relatively quickly from 1.1236 to 1.1179 but the momentum break lower was quickly reversed to 1.1210.  The rebound shows that the market is simply playing the range.     


GBPUSD extends. Makes new lows.

200 day MA approached

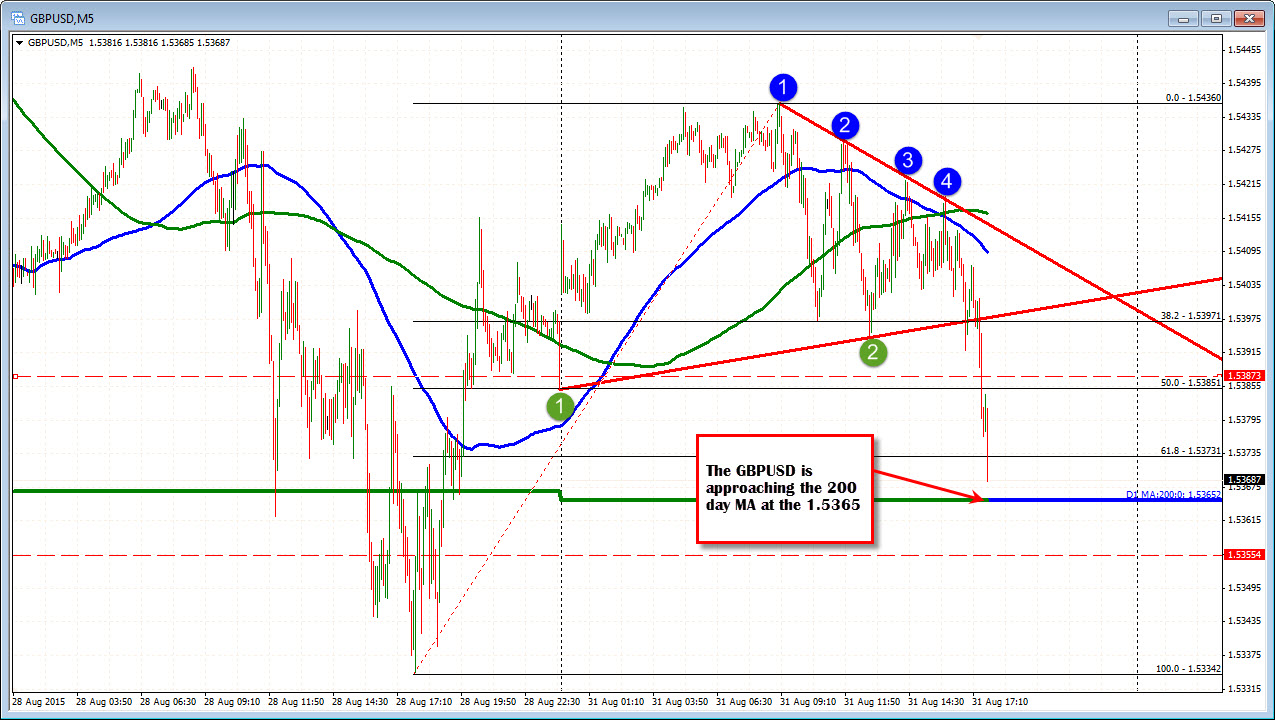
The GBPUSD is extending the days narrow trading range (see prior post). The pair is approaching the key 200 day MA at the 1.5365 level. The price fell below this MA on Friday for the first time since July 10 but could not close below that level. A break and close below would be more negative for the pair. Testing.


Month-end fixing will underpin US dollar - Barclays

Barclays Capital's month-end rebalancing model generates USD buying signals across the board

"We expect the passive rebalancing of hedges at month-end to lead to decent amounts of USD buying against all of the major currencies we include in our analysis," Barclays projects.
"Renewed concerns about the health of the Chinese economy led to a bout of global risk-off moves causing extreme losses in equity markets all across the board. The market value of the US equity market (because of its size) fell significantly relative to the rest of the world, while gains in bond markets were moderate," Barclays notes.
"Our model, which works under the assumption that static FX hedge ratios are maintained, shows strong USD buying signals into month-end against major currencies," Barclays concludes.
For trade ideas from banks, get a free trial of eFX Plus.

OPEC stands ready to talk to other producers about market - OPEC publication

OPEC publication highlights the difficulties in cutting production:

  • OPEC stands ready to talk to other producers about market but this has to be on a level playing field
  • There are growing fears that under the current low price scenario investment in future oil capacity will continue to be shelved or cancelled
It highlights what OPEC has said all along -- that they understand there is over-production but they refuse to cut alone.

For the USDJPY, trying to a new direction in the NY session


Europe session tried higher

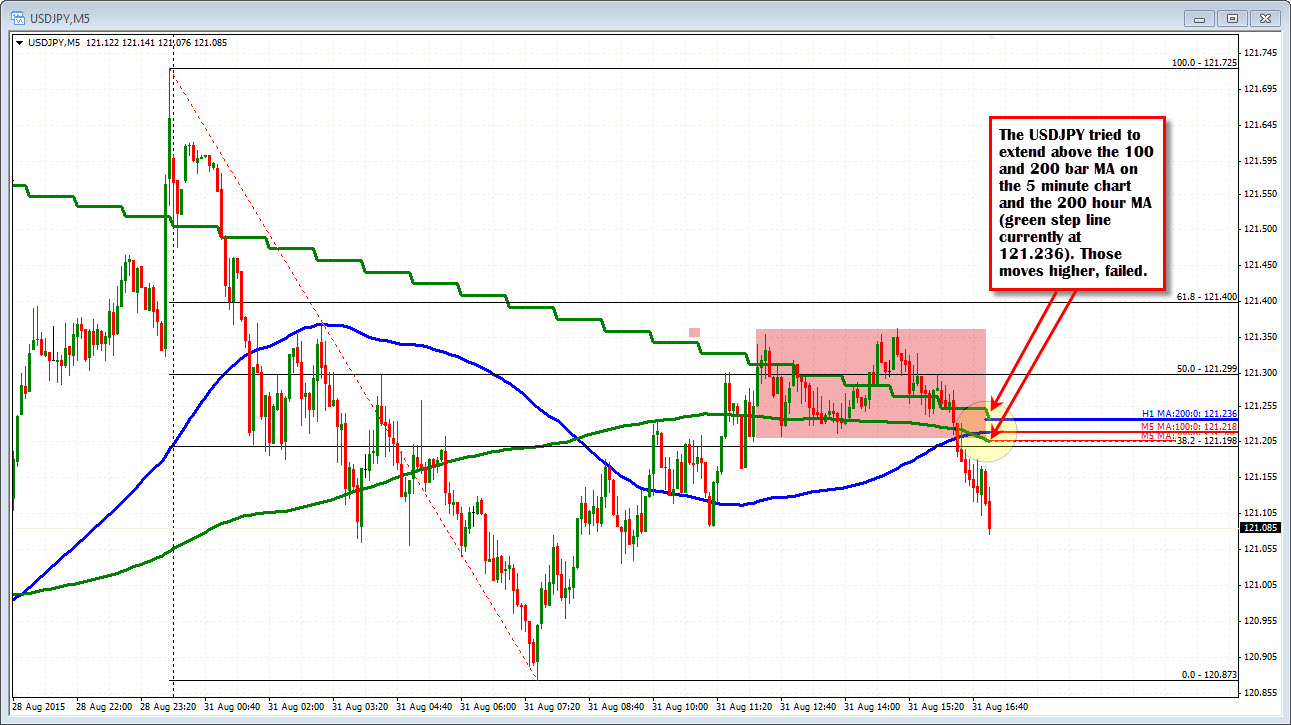
The USDJPY tried to break higher in the European session, but failed.

The price moved above the 100 and 200 bar MA on the 5 minute chart. It moved above the 200 hour MA (green step down line in the chart above), but those "breaks" all failed. 

The price for the USDJPY is now back below the 200 hour MA and both the 100 and 200 bar MAs (blue and green smoothed lines on the chart above)  It is not running away, but will it solicit move selling? Technically it should. 

What we know is risk can be defined against those technical levels above with the 200 hour MA at the 121.23 being a level for sellers to lean against, stay below, define and limit risk.  If the price can stay below, we should be able to wander down toward the lows for the day. That is the hope given the technical picture for the day.

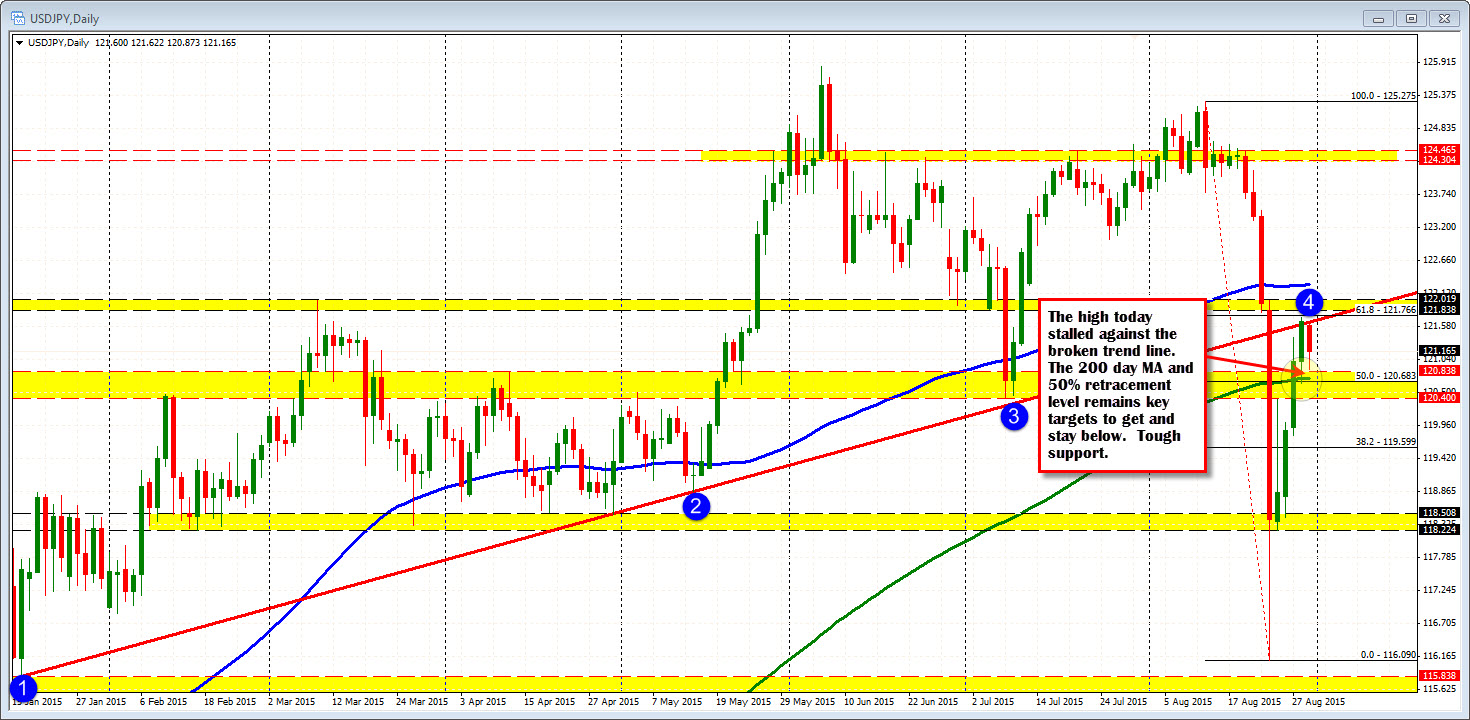
Looking at the daily chart below, the picture is showing some ambiguity. Specifically, the price has been able to hold resistance against a broken trend line at 121.68 (the high reached 121.62 today). ON the downside, the important 200 day MA and 50% retracement are at 120.73 and 120.68 respectively. The low today extended to only 120.87. Needless to say, if the bears are able to keep control (from the shorter term technical), a move below these longer term technical targets will be eyed.


Cheap gas only leads to small rise in US projected Labor Day travel

AAA projects long-weekend travel will rise 1.0% from 2014

The American Automobile Association estimates that Labor Day travel will rise just 1% from a year ago despite a 55% decline in oil prices.
That's not a great signal for an economy that the Fed believes is accelerating.

Wage inflation remains benign

On the inflation front, the White House announced late on Friday that Federal employees would get just a 1.0% pay hike in 2016.

China Abandons Government Share Repurchases of Fight Market Instability

China’s government has decided to abandon attempts to boost the stock market through large-scale share purchases, and will instead intensify efforts to find and punish those suspected of “destabilising the market”, according to senior officials.
For two months, a “national team” of state-owned investment funds and institutions has collectively spent about $200 billion trying to prop up a market that is still down 37 per cent since its mid-June peak.
China’s leaders feel they mishandled the stock market rescue efforts by allowing too much information to become public, according to senior regulatory officials speaking at a meeting late on Thursday — an account of which has been seen by the Financial Times.
Last week’s equities collapse, which prompted a rout in global markets, was partly blamed on authorities’ apparent decision to refrain from the share purchases they had been making since early July.
After standing on the sidelines for more than a week, the government resumed large-scale stock-buying in the last hour of trade on Thursday. This helped to lift the Shanghai benchmark index from a small loss to end the day up more than 5 per cent. The market rose by almost 5 per cent again on Friday.
via CNBC

GBPUSD on holiday

UK on holiday.  GBPUSD also on holiday

The UK has its summer bank holiday and the trading in the GBPUSD seems to be taking the day off as well. The pair is trading in a 42 pip trading range for the day. The average over the last 22 trading days is 115 pips. 


Taking a step back from the intraday and looking at the daily chart, the pair sits between the 100 day MA above (blue line)  and the 200 day MA (green line) below (at 1.54819 and 1.5365 respectively). The price fell below the 200 day MA for the first time since July 10 on Friday but could not close below that MA. The pair found support on Friday near the 1.5329 level (1.5334). The low in July came in at 1.5329. Since May 8, the GBPUSD has traded mostly between 1.5329 and 1.58016 (66 of 81 days has traded between that range with 8 total trading days settling outside the range).  I know it is nearly 500 pips but there is no trend over that period. The price has been up and down and up and down.  We are currently down and with the price between the 100 and 200 day MAs the "market" is not ready to make a break just yet.

This week, the economic schedule is light in the UK with Manufacturing, Construction and services PMI data. Next week, the BOE has their interest rate meeting.  With economic activity light, it might be more of a dollar trade this week. 

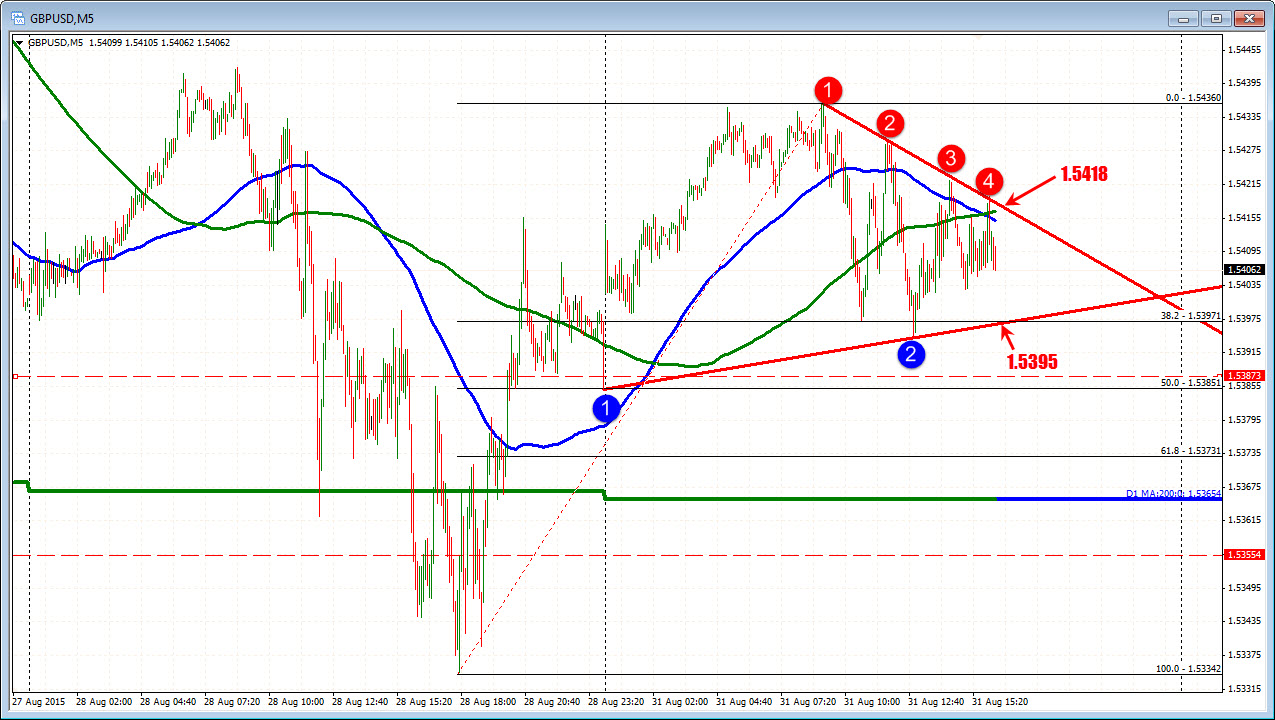
So what is the intraday technicals showing? The pair has a ceiling against a topside trend line That trend line is now near the 100 and 200 bar MA on the 5 minute chart (all near 1.5418). ON the downside, the 1.5395  is a lower trend line and also the 38.2% of the move up from Friday (at 1.5397). A move below that level will be more beairish with that importand 200 day MA at 1.5365 looming.  


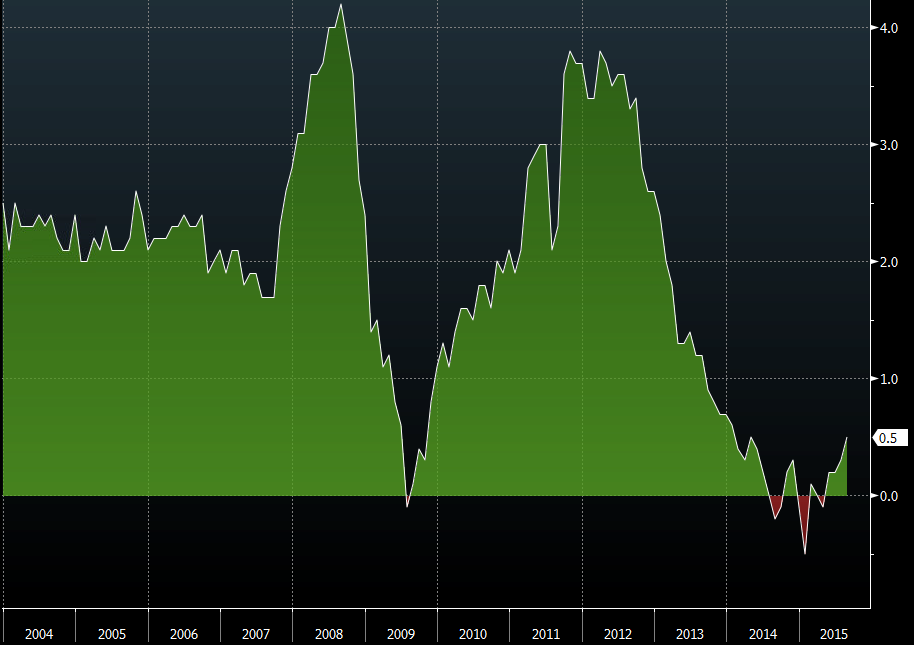
August 2015 Italy HICP flash 0.5% vs 0.3% exp y/y

Highlights of the August 2015 Italy HICP flash data report 31 August 2015

  • Prior 0.3%
  • 0.0% vs -0.2% exp m/m. Prior -1.9%. Revised to -2.0%
  • CPI 0.2% vs 0.1% exp y/y. Prior 0.2%
  • 0.2% vs 0.1% exp m/m. Prior -0.1%
  • Core 0.7% vs 0.8% prior y/y
The CPI was higher that the HICP number m/m as it does not include the discount prices the HICP takes note of
Still, it takes Italy further away from the deflation line
Italy HICP y/y

China construction bank has lent China Securities Finance Corp ¥148bn

Reuters with the headlines from China's construction bank

  • Has provided ¥50-60bn credit line to securities firms
  • Banks risk exposure to stock market is low
  • Less than ¥20 of loans is collateralised with stock
  • Market volatility has little impact on bank
The Securities Finance Corp was one of the vehicles being used to buy stocks and this is one of the banks they've drawn funds from

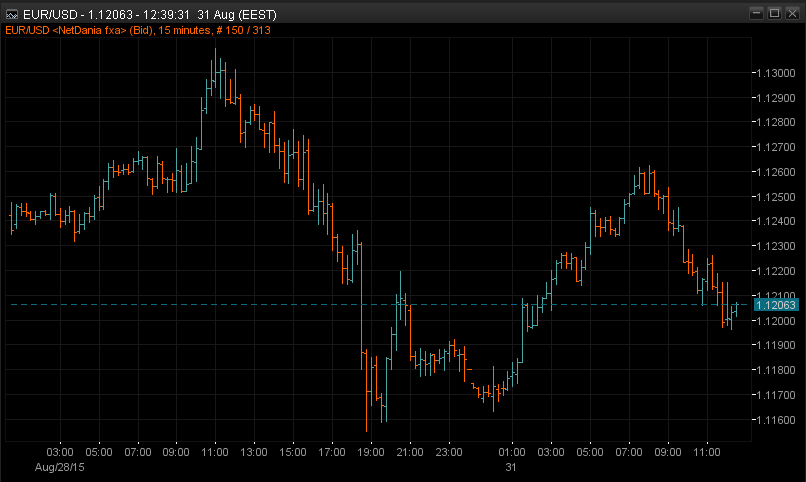
EURUSD back above 1.1200 after probe below

It's all pretty slow stuff for the euro

A dip below 1.1200 didn't last long and the buyers have taken it back above, albeit by just a few pips
1.1210 provides resistance ahead of 1.1230. We may seem some minor resistance at 1.1220 also
EURUSD 15m chart
I've taken half of my shorts off seeing as the inflation numbers weren't worse than expected, and the fact that 1.1200 seems to be putting in a brave fight. I'd rather bank some and lock the profit in on the rest than sit here for hours watching my gains erode

ForexLive European FX wrap: Early cold wind from China recedes

Forex news, data and trading headlines for the European session 31 August

We were risk off as the European session kicked off with stocks in Asia showing good losses. EURUSD kept the tone going by continuing its ascent which topped out 101 pips up from the lows at 1.1262. It didn't take long for European players to take advantage of a stock comeback in Asia into the closes and we came off to around 1.1235/40. German retail sales we worth a few pips higher but that didn't last, and not even inflation holding up in the EZ could turn their arm and 1.1200 was tested. A few pips were seen under the big figure and the euro looks to be trying to make a base there
Despite the UK holiday GBPUSD is still trading, although in a tighter range than the euro. It's mooched around in 40 or so pip range between 1.5435 and 1.5395
USDJPY was following the Nikkei around and took 12 pips under 121.00 at the worst point. Again a late rally there saw a bottom in the currency and we trundled back to near 121.40.
It's pretty slow going all round though and it's now up to the US to make sense of the weekend Jackson Hole appearances and what it means for the Fed. By and large the message was that the good ship FOMC should stay on it's current path so that might bring some relief from US traders

JP Morgan says the odds of a Sep Fed liftoff are higher than for any other single meeting

JP Morgan give their verdict on Jackson Hole

JPM say that the Jackson Hole comments left them comfortable with their view that the odds for a Sep liftoff are higher than for any other single meeting
Although they say odds are less than 50%, they see it at 35-40%
They maintain their view that Fed squawkers generally kept the tone that the data and market developments between now and the FOMC could easily sway the decision
The payrolls report on Friday is going to be another huge one with the Sep FOMC just around the corner after that. There's plenty of other big data before then with manufacturing PMI's tomorrow, factory orders on Wednesday and non-manufacturing PMI on Thursday, to name a few

China to close around 10,000 factories this week to ensure blue skies for big parade

Xinhua News Agency reports on preparations for the big parade in Beijing on Thursday

  • Temporary controls to last from August 28 to September 4
  • More than 10,000 factories reducing or stopping production
  • The suspension order for factories and steel mills covers a total of seven provinces      
  • Work on nearly 9,000 construction sites stalling
  • Restrictions on road traffic
  • China is planning a parade to mark the 70th anniversary of the end of World War II
  • The area affected is bigger than that during APEC in November 2014
-
Let's hope it all goes off smoothly and safely. Markets will, of course, be concerned about the impact of slowing production in China amidst broader concerns on the economy.

ISM Milwaukee 47.67 vs 47.12 prior

Purchasing managers index for the Milwaukee region:

  • Prior was 47.12
  • There were 3 estimates in a BBG survey, the 'consensus' was 50.0
The Chicago PMI is due at 45 minutes past the hour.

Canada Q2 current account balance -17.4B vs -16.9B expected

Canada Q2 current account balance:

  • Prior was -$17.5B (revised to -$18.15B)
Soft report with negative revisions. It's more reason to believe that Canada is already in recession, or very close.

EURUSD settles as North America joins the quiet Monday trade

London holiday slows the market activity

This week is a London bank holiday. Next Monday is a US bank holiday. Just a little more summer to deal with traders.  Today there is some "minor" US data released with the Chicago PMI, Milwaukee and Dallas Fed manufacturing indices.  Chicago will probably be the most important (at 9:45 AM, estimate 54.5 vs 54.7 last).  The index has a 12 month high of 64.5 (Oct 2014) and low of 45.8 (in Feb 2015).  In Europe the CPI data did not falter even though energy prices were down 7.1%. Weekend Jackson Hole comments seem to suggest the plan to raise rates remains intact for 2015. Will they raise it in September still remains the big question. 


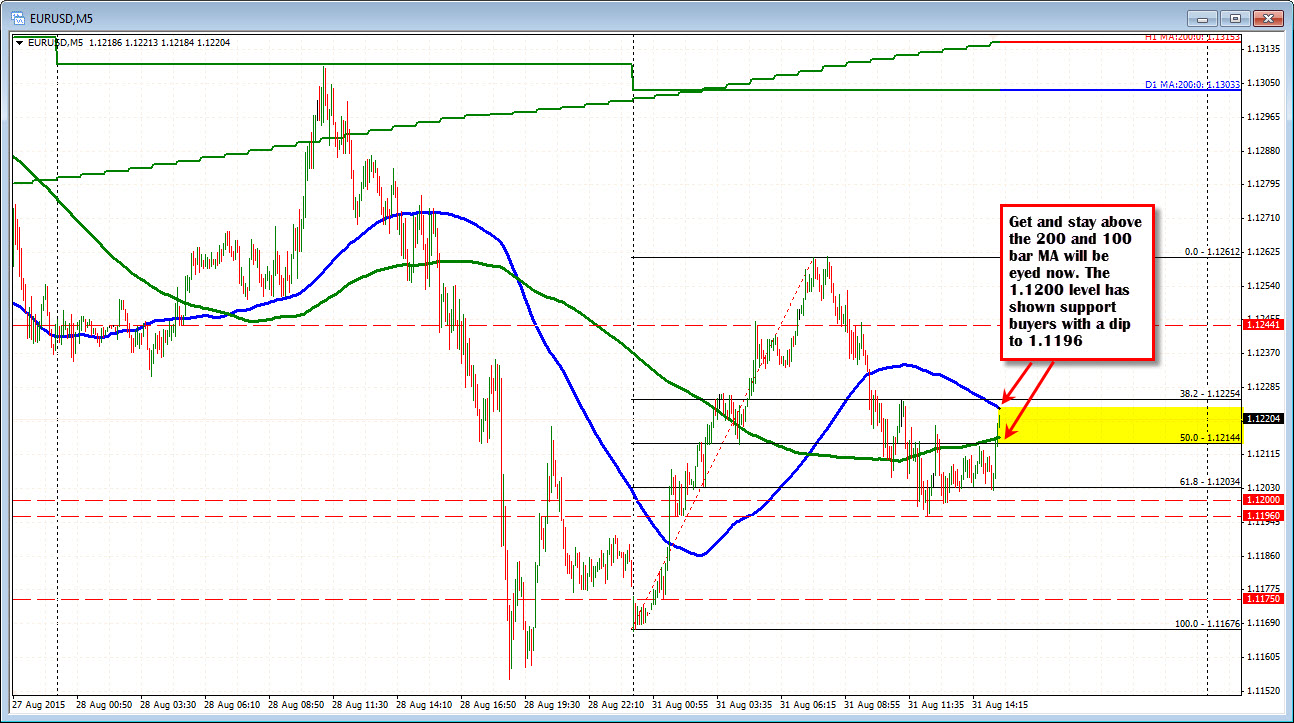
The EURUSD is higher on the day but trading back down near the midpoint of the days range. The market could not sustain a rally after the inflation data did not disappoint (it was not great but did not surprise to the downside). The market price has been trading mostly above the 1.1200 level (the low price dipped to 1.1196).  Looking at the 5 minute chart, getting above the 1.1214-16 level (50% of the days range and 200 bar MA), followed by a break of the 100 bar MA 1.12230 would be eyed for more bullish intraday bias (need to stay above). 

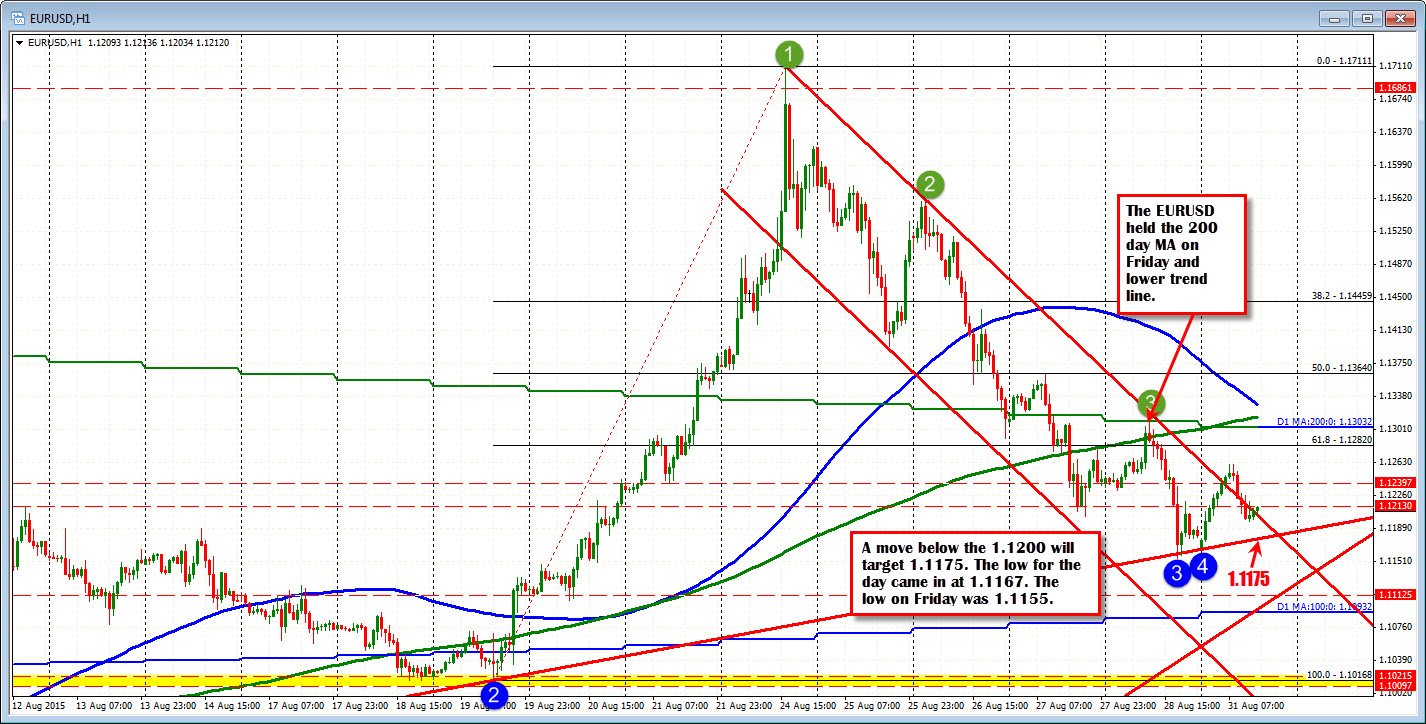
A failure to do so, would have traders thinking of another shot at the 1.12000 level.  Getting and staying below the 1.1200 level will look toward the 1.1175 where a trend line on the hourly chart (from August 7th low) cuts across. The low in the first hour of trading today came in at 1.1167, the low on Friday was at 1.1155.  All become targets in trading today.  

So far, the 100 and 200 area are holding on the 5 minute chart, but activity is still slow.


EIA saw slightly lower June oil production in new survey

EIA creates new survey to measure US oil production

  • June oil production at 9.3 million barrels per day vs 9.4mbpd in May
  • Jan-May production revised downward by 40-130K bpd
  • Oil production for the first six months of 2015 averaged 9.4mpbd
The EIA revealed the new metric in a press release titled 'EIA improves monthly reporting of crude oil production'. It promises to be an important (although laggy) release.
They note that because of rapidly growing domestic production, policymakers and market participants are closely watching how producers respond and this survey is a response to demands for better data.
"The expanded survey collects monthly oil production data from a sample of operators of oil and natural gas wells in 15 individual states and the federal Gulf of Mexico; production from all remaining states and the federal Pacific is reported collectively in an "other states" category ... The survey-based approach improves estimates by representing more than 90% of oil production in the United States," they say.
The data will be released on the final day of each month.

All about the flows as August winds down

It's month-end and the UK is on holiday

It's a dangerous day to try and make sense of market moves. The volatility last week is forcing some large fund rebalancings. These should add a US dollar bid but it's competing with a generally risk-negative theme.
S&P 500 futures are down 20 points and have come under some pressure in the past 10 minutes. That's helping give a lift to EUR/USD.

GBP/USD hovers around Aug 7 low

The GBP/USD spot is trading around 1.5424 (Aug 7 low) amid low volumes on account of the bank holiday in London.

USD resilient to weak equities

The US dollar has managed to keep losses under check even though major European indices are trading in the red. The risk aversion in Asian equities has been carried forward by Europe. Germany’s DAX is down more than 11% and the pan-European Stoxx 600 fell 0.40%.

However, the drop has not affected the treasury yields significantly. The 2-yr yield, which mimics rate hike expectations, stays resilient around 0.731%. Moreover, bets on a September Fed liftoff climbed after Vice Chairman Stanley Fischer said there is “good reason” to believe inflation will accelerate.

GBP/USD Technical Levels

The spot currently trades around 1.5425. The immediate resistance is located 1.5450 (23.6% of last week’s drop) followed by a hurdle at 1.5482 (100-DMA). On the flip side, support is seen at 1.54 (daily low) and 1.5335 (Friday’s low).

ECB's Nowotny says it's a challenge for Eurozone that US growth is faster

Ewald Nowotny on BBG

  • Says he's glad situation in Greece is stabilising
Remember that we won't get any monetary policy talk from ECB members in the run up to the meeting on Thursday

GBP/USD supported by 200-d MA – Commerzbank

Axel Rudolph, Senior Technical Analyst at Commerzbank, noted the recent pullback in spot was well supported in the vicinity of the key 200-day MA.
“Intraday rallies should struggle 1.5500/40 ahead of 1.5660 and the 1.58175 recent high”.
Key Quotes

GBP/USD has sold off to the 1.5368 200 day ma where it is currently being supported. Directly below lies the 1.5332 July low which may soon be reached”.

“A close below here is looking increasingly likely and will trigger losses to the 1.5172 June low and 1.5088 the 61.8% retracement”.